A decade ago, we predicted that the US dollar would achieve far greater value and that the US would attract more investment. That’s exactly what happened. Now, we see the USD as having peaked. This turning point creates a series of potential opportunities that are reflected in our updated Strategic Return Estimates (SRE)1 for non-US assets.

As US dollar dominance ends, currencies may drive returns
The king of currencies?
The US dollar is arguably the most successful fiat currency in history. Its widespread use as a store of value in finance and trade since World War II has made it the “king of currencies” in modern times. US dollar assets make up nearly 60% of the foreign reserves of the world’s central banks, while 88% of the world’s trade is invoiced in dollars.
In our Mid-Year Wealth Outlook a decade ago, we forecasted that “major financial trends of the past decade are reversing. Important trends including the falling US dollar.. and global investor outflows from dollar-denominated investments are at an end.” Sure enough, in the ten years since, the US dollar soared, and investors returned to the US with a vengeance.
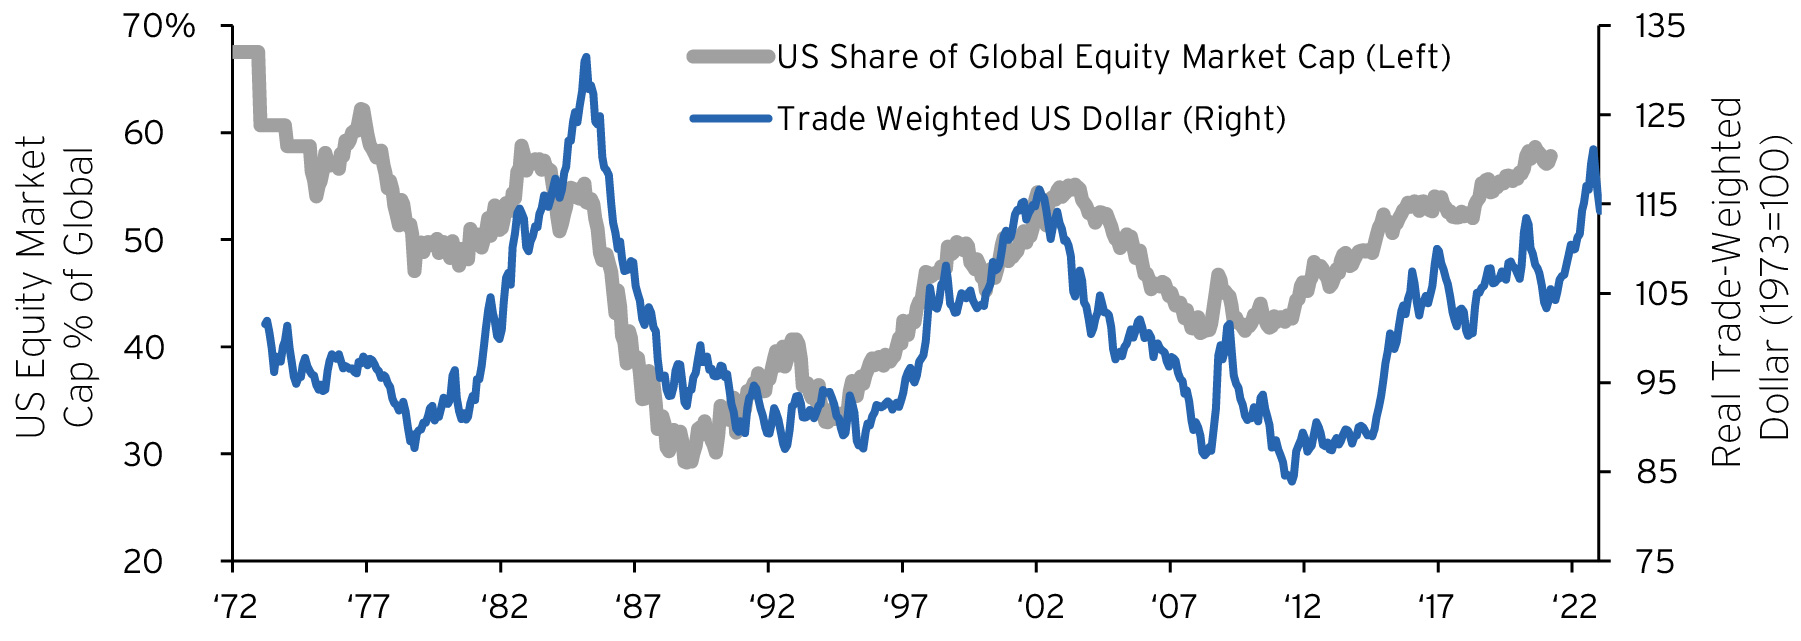
Now we see another reversal at hand. We believe the dollar is likely entering a secular bear market, its third in the past 50 years (FIGURE 1). Confidence, as expressed in dollar holdings worldwide, is peaking and so is the relative valuation of US equities.
The Federal Reserve did the US no favors when it supported a huge fiscal expansion in 2021. What followed was monetary inflation. The Fed then sent the US dollar rising to its second-highest historic level in 2022 by embarking on a rapid tightening campaign that outstripped the tightening efforts of the rest of the world’s central banks.
Figure 1. Strong US Dollar and US Equities
Source: Haver Analytics and Bloomberg as of April 22, 2023. All forecasts are expressions of opinion and are subject to change without notice and are not intended to be a guarantee of future events. Indices are unmanaged. An investor cannot invest directly in an index. They are shown for illustrative purposes only and do not represent the performance of any specific investment. Index returns do not include any expenses, fees or sales charges, which would lower performance. Past performance is no guarantee of future results. Real results may vary.
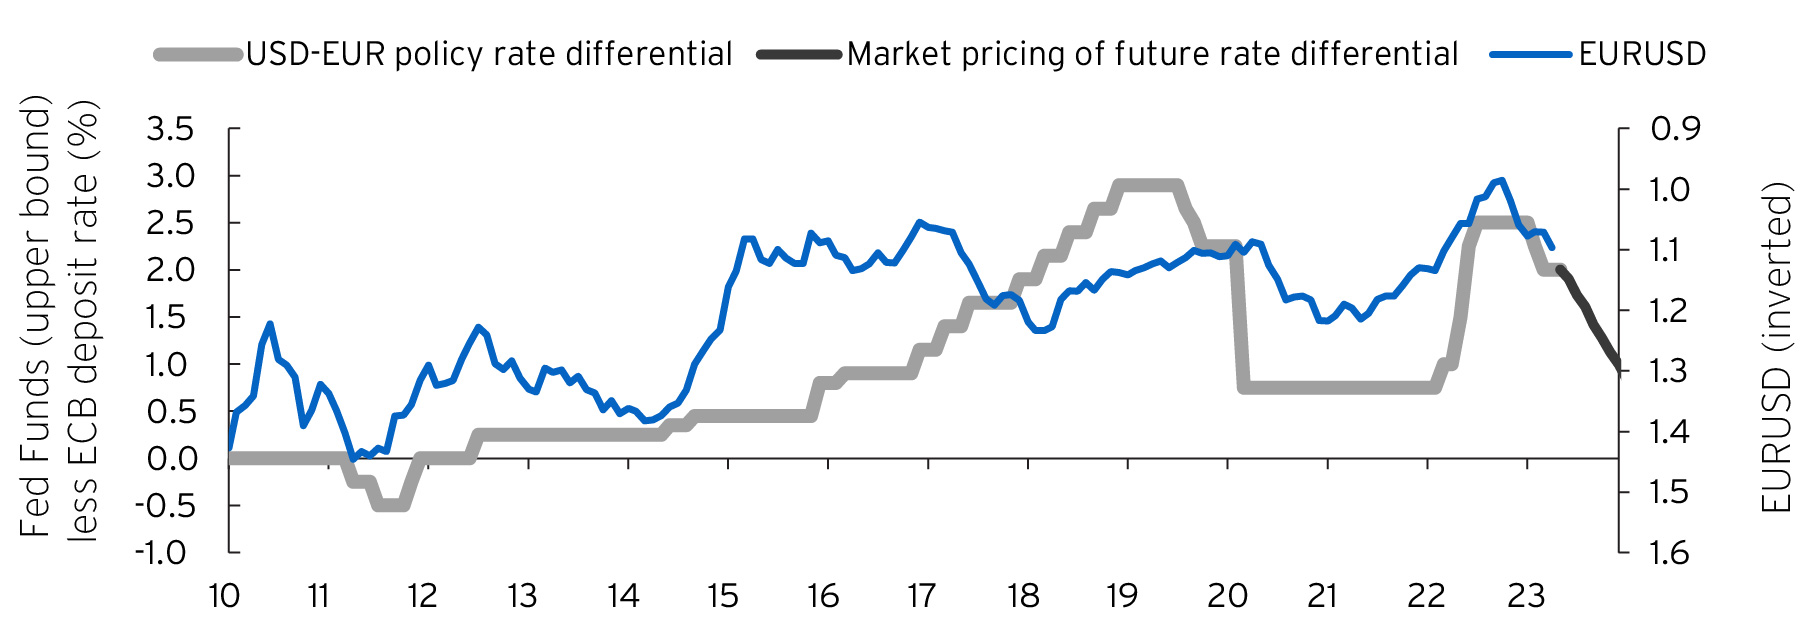
Figure 2. Diverging USD-Euro Policy Rates
Source: Haver Analytics as of May 4, 2023. All forecasts are expressions of opinion and are subject to change without notice and are not intended to be a guarantee of future events. Past performance is no guarantee of future results. Real results may vary.
A turning point just ahead of us
Ultimately, the highly cyclical US labor market and the Fed’s mandate to support maximum employment will likely undermine the dollar in the coming years. By the end of 2024, we expect the Fed to unwind half its 2022-2023 tightening steps while other central banks remain steady (FIGURE 2 and 3).The larger question for US exchange rates is “what’s in the price?” While we are oversimplifying slightly, the near record high US dollar means that there is an embedded expectation that the US will have stronger real economic growth and less inflation than other countries in the years ahead. The Fed’s aggressive interest rate hikes attracted inflows from international investors seeking yield. Those inflows will likely slow during the upcoming Fed easing cycle, weakening the dollar.
The dollar’s decade-long rise helped drive US equities toward a record 62% share of the world’s equity market capitalization last year (FIGURE 1). This hasn’t come without a cost elsewhere. Non-US equities currently hug a record low valuation compared to the US, nearly 40% below current-year earnings per share (EPS) estimates, and nearly 30% below a 10-year average of actual EPS (FIGURE 4). While US firms may outgrow global peers based on their industry and individual merits, such a premium valuation requires continued outperformance.
We believe that some foreign firms could potentially make competitive headway against US companies and that returns from non-US equities may increase if foreign currencies appreciate against the dollar.
Figure 3. Rapid Rate Hikes Expected to Ease
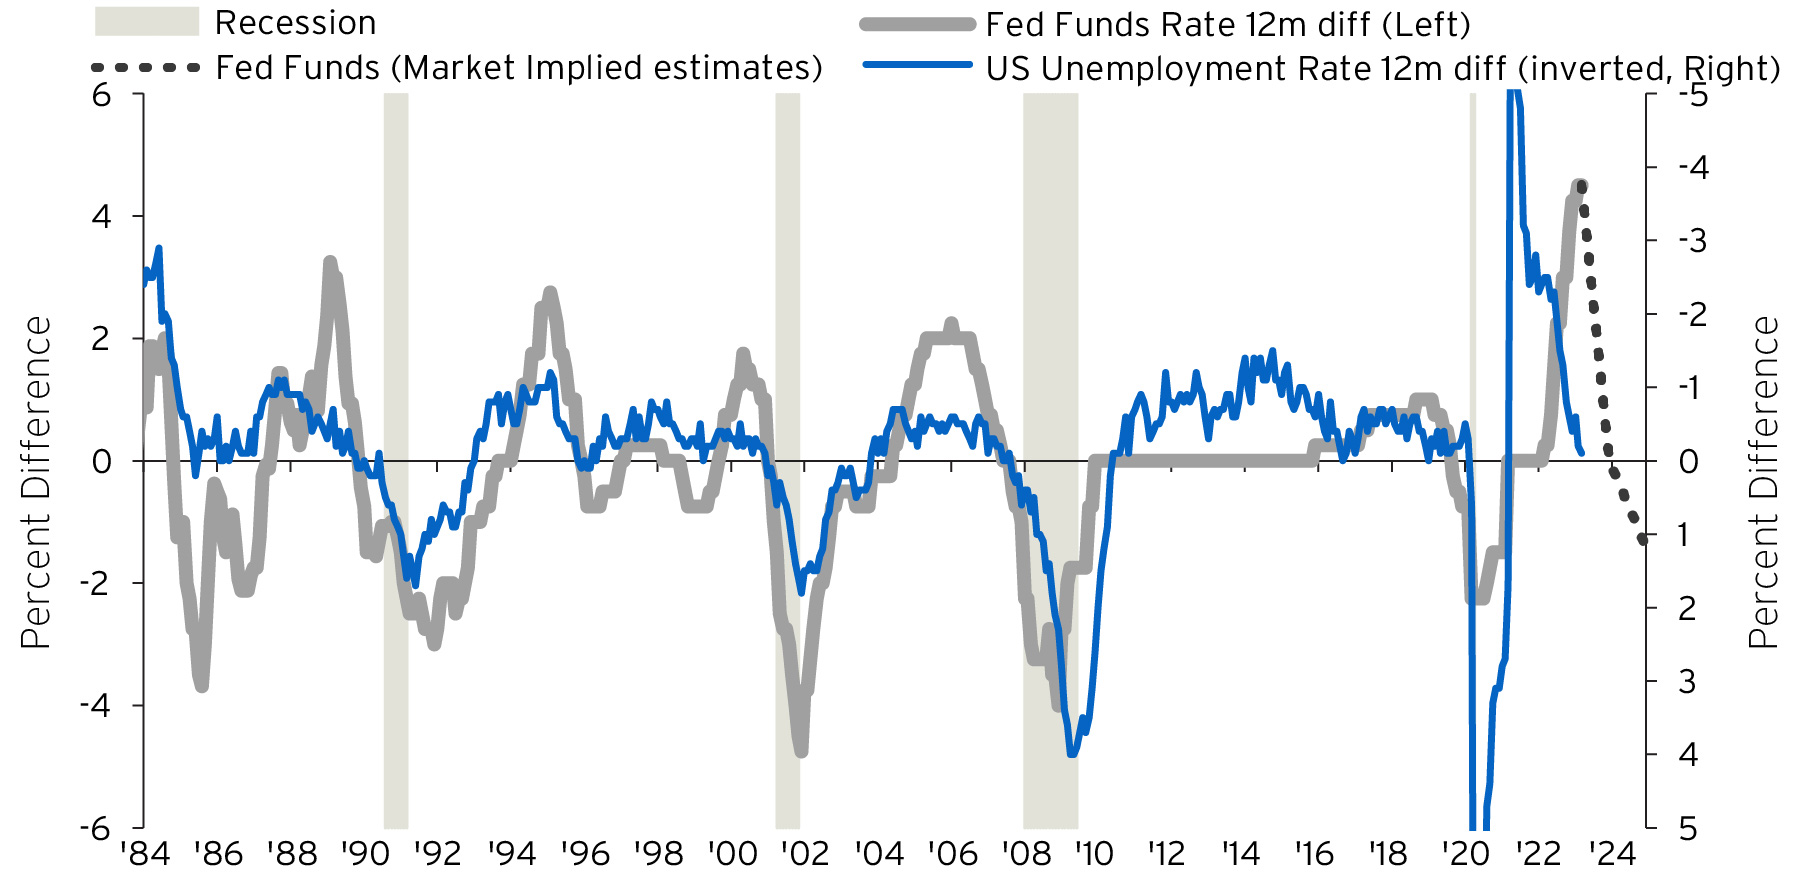
Source: Haver Analytics and Bloomberg as of May 2, 2023. The gray shaded areas are US recessions. All forecasts are expressions of opinion, are subject to change without notice and are not intended to be a guarantee of future events. Past performance is no guarantee of future results. Real results may vary.
Figure 4. Non-US Equities at a Discount to US Equities
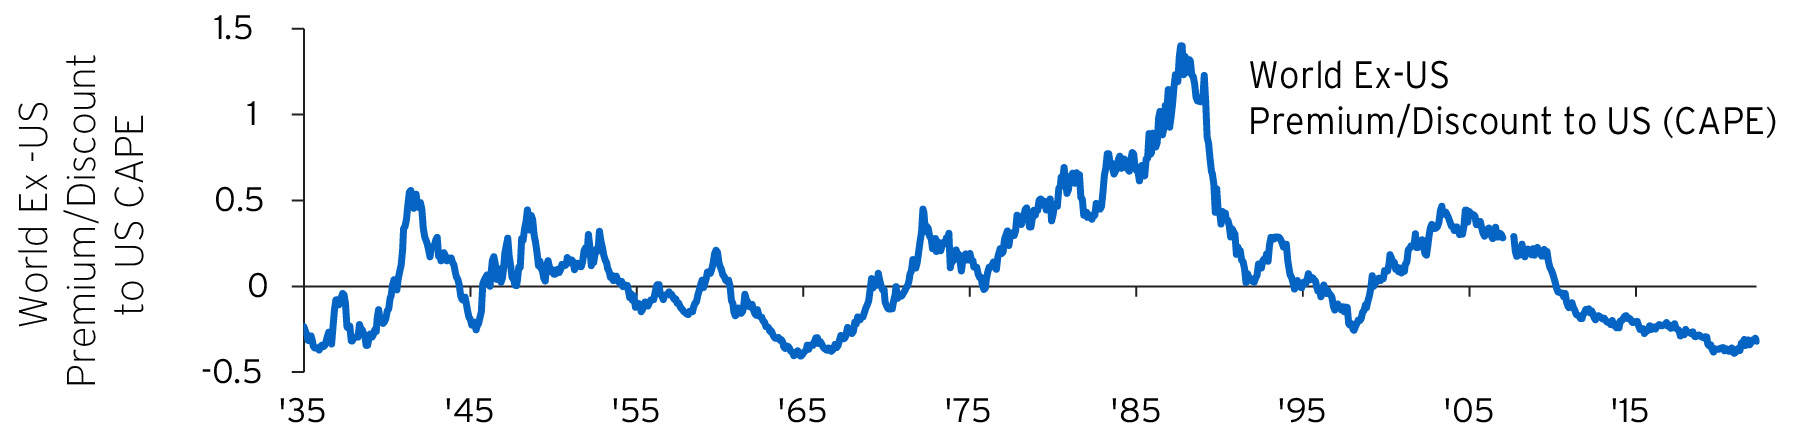
Source: Factset as of April 21, 2023. All forecasts are expressions of opinion and are subject to change without notice and are not intended to be a guarantee of future events. Indices are unmanaged. An investor cannot invest directly in an index. They are shown for illustrative purposes only and do not represent the performance of any specific investment. Index returns do not include any expenses, fees or sales charges, which would lower performance. Past performance is no guarantee of future results. Real results may vary. The CAPE ratio is a valuation measure that uses real (EPS) over a 10-year period to smooth out fluctuations in corporate profits that occur over different periods of a business cycle.
China and crypto aren’t the catalysts for the dollar’s decline
Over the decades, we’ve heard numerous spurious predictions of the US dollar’s demise only to see it appreciate. The stories behind a collapse in the dollar typically involve China. Like most other global traders, China has no particular interest in conducting business in US dollars, a currency it can’t control. The crypto world is another dollar naysayer, with a self-interest to promote alternative monetary systems. More than once, crypto pundits have pronounced the sudden end of the US dollar.
Of course, an important story that didn’t get much attention was the US government’s decision to freeze much of Russia’s more than $600 billion in foreign reserves. This alerted US antagonists to the potential risk of holding US dollars to bolster domestic currencies. Nonetheless, central bank foreign reserve holdings and the US dollar’s value are very lightly correlated in all but long-term periods.
Yet at present valuation levels - and the already deep penetration of the US dollar in portfolios and trade – forward-looking fundamentals simply suggest some unwinding of the US dollar’s past decade of gains.
Seeking returns as the dollar declines
The Fed’s abrupt tightening cycle and the Russian energy shock sank many currencies to record lows last year against the US dollar. The recent key pain point for Europe was the significant surge in natural gas import costs last autumn as Russian supplies were cut off. This generated a “term-of-trade shock” and a brief economic contraction. Since then, we’ve raised our economic outlook and our allocation for the depressed region with its low expectations (See Recession, recovery: A journey unfinished and Europe: Selective opportunities amid modest growth).
We expect some emerging markets, including China and Brazil, to ease monetary policy in the coming year. Given the backdrop of US rate cuts in the coming year, this should provide a boost to local markets and economies (FIGURE 5). We’ve broadened our overweight allocations in recent months to include a wider swath of Asian equities markets. We expect to make additional moves when we see the recognition of US economic risks more fully priced.
Figure 5. China Recovery Impacts the Association of Southeast Asian Nation (ASEAN) Equities
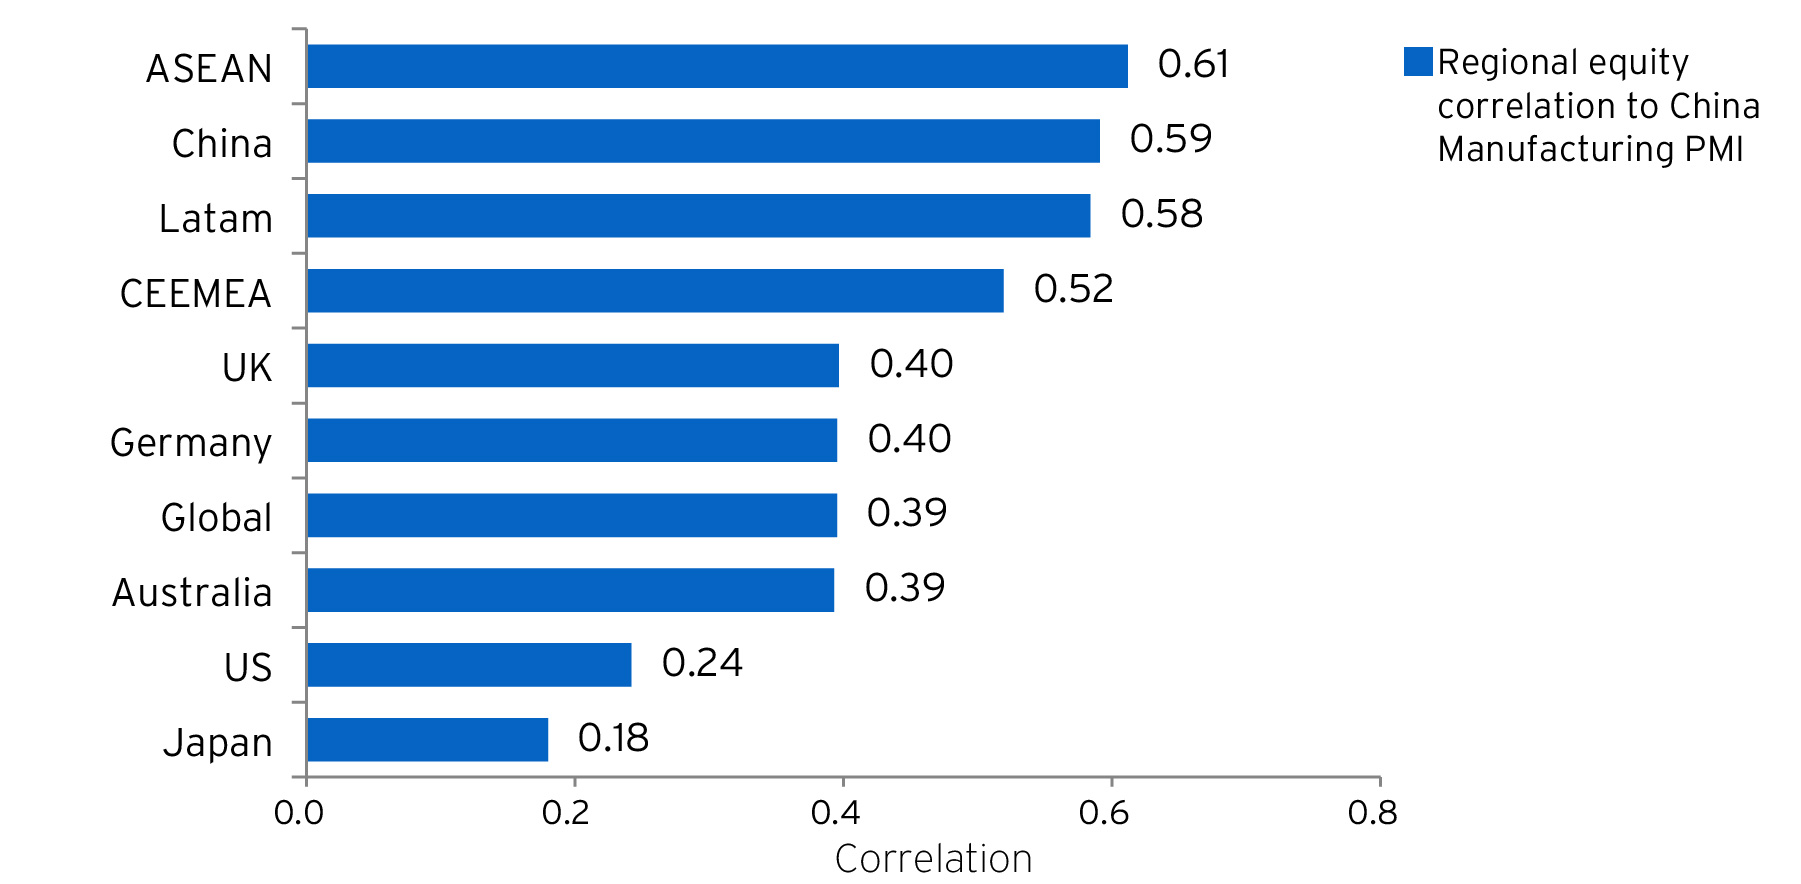
Source: Bloomberg as of January 31, 2023. Indices are unmanaged. An investor cannot invest directly in an index. They are shown for illustrative purposes only and do not represent the performance of any specific investment. Index returns do not include any expenses, fees or sales charges, which would lower performance. Past performance is no guarantee of future results. Real results may vary. The Association of Southeast Asian Nations (ASEAN) is a political and economic union of 10 member states in Southeast Asia.
The movements of foreign capital have historically been a powerful force affecting local equity returns. The factors that drive foreign investors to acquire more net US assets are generally the same factors that drive local returns (FIGURE 6). This is especially true in emerging markets where confidence in local currencies is currently low and inflation is abating, which supports the higher relative returns for emerging markets in our updated Strategic Return Estimates– (FIGURE 7 and 8). A strong growth environment and low inflation are typically positive for equities even if it hurts the competitiveness of exporters.
Understanding the strategic return estimates (SRE)1
The 2022 market decline – the largest combined falls in equities and fixed income since 1931 –may be a reason for higher future returns across markets. This potentially is true for non-US markets starting at a lower initial valuation.A second reason why USD returns can exceed prior periods is the dollar’s likely decline. Our asset class Strategic Return Estimates (SRE’s) for emerging equities and fixed income suggest a 12.9% and 7.8% respective potential return opportunity per annum over the coming decade.
| Decade ending in December | Annualized Real Total Returns S&P 500 (%) | Change in Real Broad Trade Weighted Dollar Index (%) |
|---|---|---|
| 1970s | 0.4 | -13.9% |
| 1980s | 13.8 | 3.4% |
| 1990s | 28.4 | 8.3% |
| 2000s | -0.9 | -12.1% |
| 2010s | 11.9 | 17.7% |
Source: Bloomberg as of April 25, 2023. Indices are unmanaged. An investor cannot invest directly in an index. They are shown for illustrative purposes only and do not represent the performance of any specific investment. Index returns do not include any expenses, fees or sales charges, which would lower performance. Past performance is no guarantee of future results. Real results may vary.
Figure 7. Emerging Markets Equities at Discount to US Equities
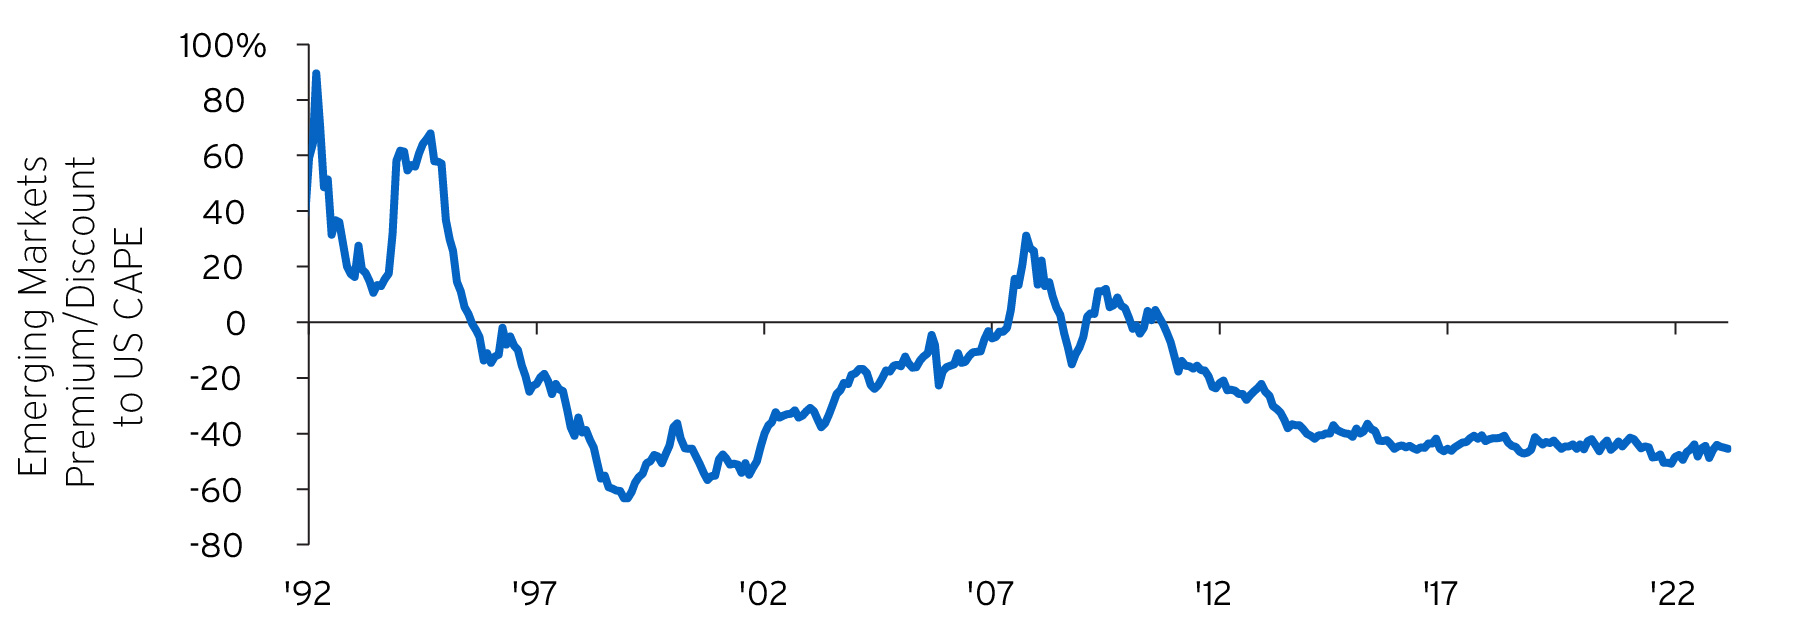
Source: Factset as of April 21, 2023. Indices are unmanaged. An investor cannot invest directly in an index. They are shown for illustrative purposes only and do not represent the performance of any specific investment. Index returns do not include any expenses, fees or sales charges, which would lower performance. Past performance is no guarantee of future results. Real results may vary.
Figure 8. Emerging Markets Sentiment Currently Low
Source: Bloomberg and Haver Analytics as of May 4, 2023. Indices are unmanaged. An investor cannot invest directly in an index. They are shown for illustrative purposes only and do not represent the performance of any specific investment. Index returns do not include any expenses, fees or sales charges, which would lower performance. Past performance is no guarantee of future results. Real results may vary.
Contact us
To help put you in touch with the right Private Bank team, please answer the following questions.