The market rebound in 2023 has reminded investors of the futility of market timing. While the worst looks to be behind us, the bear market journey is not yet complete. Investors can potentially benefit from income-generating assets while beginning to reengage portfolios in a number of building valuation opportunities and long-term growth generators.

Recession, recovery: A journey unfinished
2023’s first half performance for world financial markets should remind investors of the folly of market timing. Despite ample worries to the contrary, global equities have returned 8.0%2 in the year to date and global bonds 2.0%.3
Of course, this rebound followed 2022’s abysmal results, the worst combined US stock and bond market performance since 1931. It was a severe reckoning; the price to pay for government actions that overstimulated the economy during and after the COVID shock, then reversing course to tame the resulting inflation.
Investment opportunities ahead
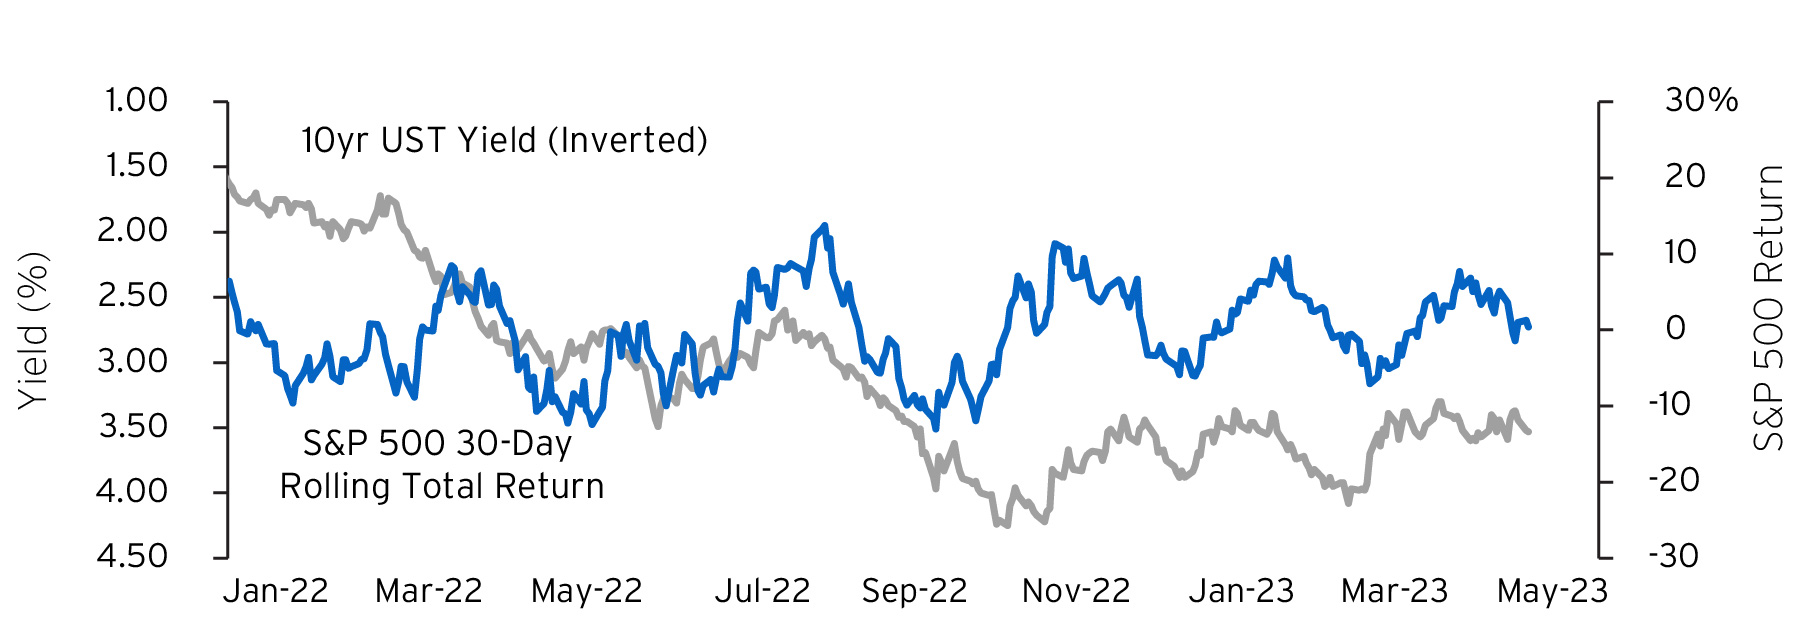
The double-digit declines in 2022 created stronger investment opportunities than the initial economic recovery of 2020-2021. Though off their highs, US government bond yields have risen three to four percentage points across different points of the yield curve (Figure 1). There’s been a significant rotation out of speculative investments into conservative, income-generating assets. All these developments have improved our long-term strategic asset returns estimates for the decade to come (Figure 2 and 3).
Figure 1. US Treasury Yields Highest since 2007
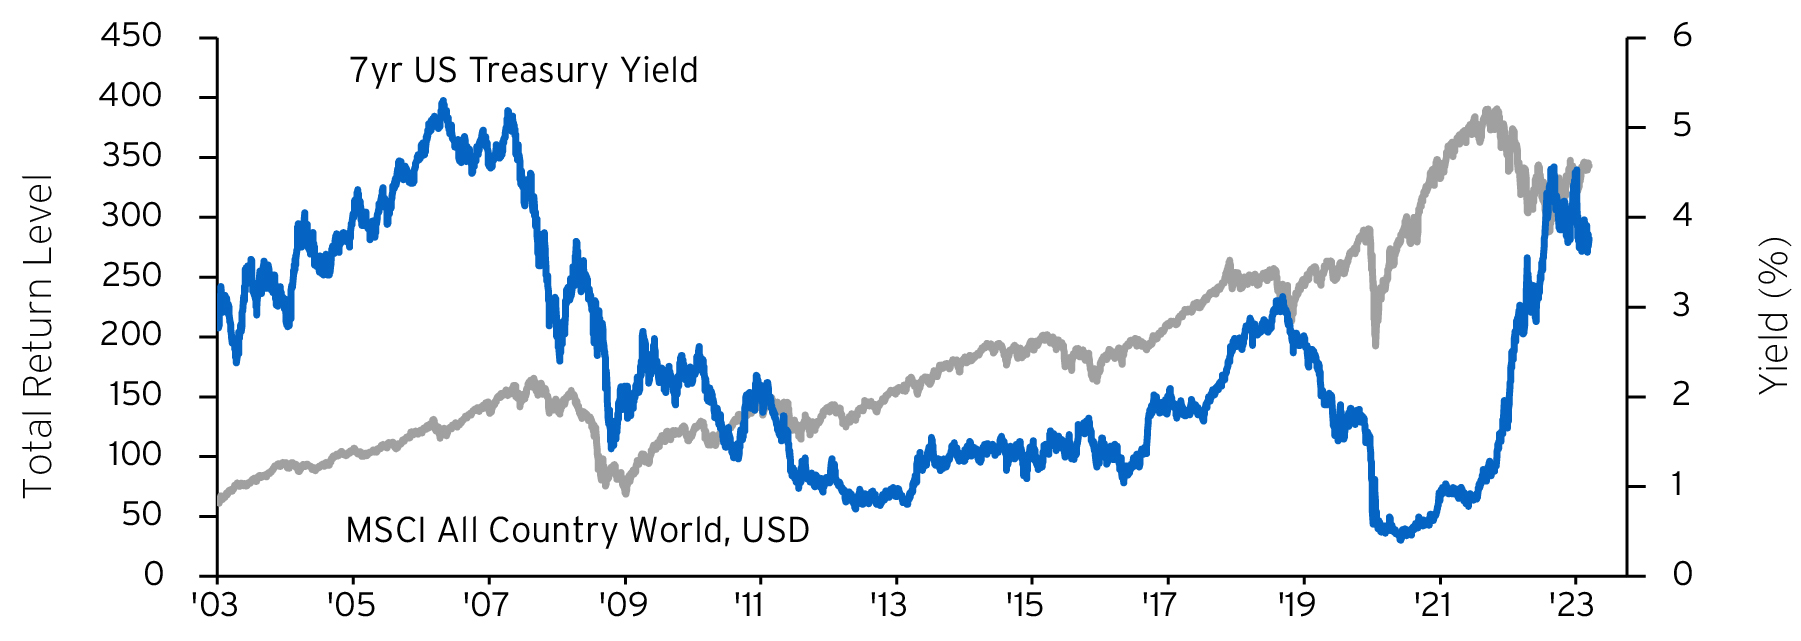
Source: Bloomberg as of May 4, 2023. Indices are unmanaged. An investor cannot invest directly in an index. They are shown for illustrative purposes only and do not represent the performance of any specific investment. Index returns do not include any expenses, fees or sales charges, which would lower performance. Past performance is no guarantee of future results. Real results may vary.
Figure 2. Sobering: Unprofitable Firms Have Seen an Historically Large Decline
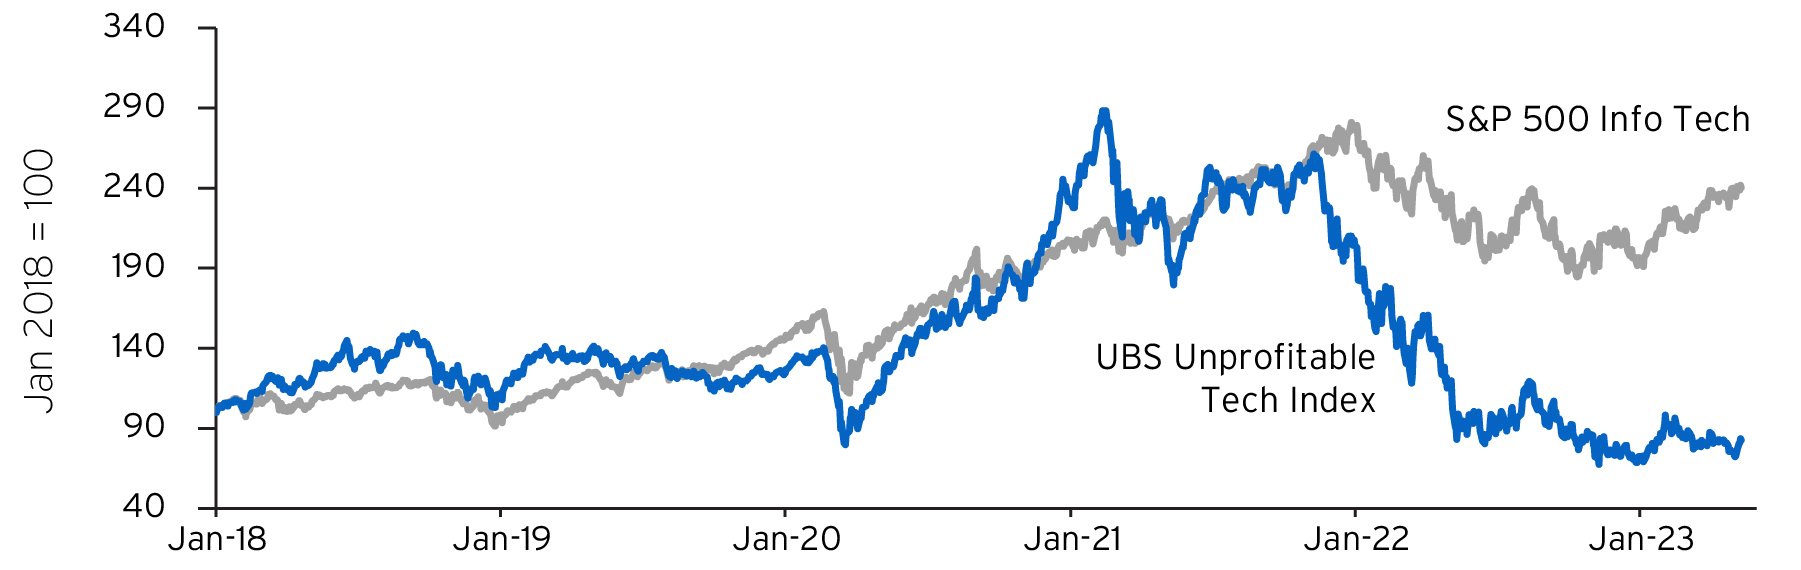
Source: Bloomberg as of April 4, 2023. Indices are unmanaged. An investor cannot invest directly in an index. They are shown for illustrative purposes only and do not represent the performance of any specific investment. Index returns do not include any expenses, fees or sales charges, which would lower performance. Past performance is no guarantee of future results. Real results may vary.
| Asset Class | 2023 SRE | 2022 SRE |
|---|---|---|
| Developed Market Equities | 7.0% | 3.8% |
| Emerging Market Equities | 12.9% | 8.1% |
| Investment Grade Fixed Income | 4.6% | 1.8% |
| High Yield Fixed Income | 7.4% | 2.6% |
| Emerging Market Fixed Income | 7.8% | 3.6% |
| Cash | 3.4% | 0.9% |
| Hedge Funds | 9.1% | 4.1% |
| Private Equity | 17.6% | 11.6% |
| Real Estate | 10.6% | 8.8% |
| Commodities | 2.4% | 1.5% |
Source: Citi Global Wealth Investments’ data as of October 31, 2022. Strategic Return Estimates (SRE) based on indices are Citi Global Wealth Investments’ forecast of returns over a 10-year time horizon for specific asset classes (to which the index belongs). Indices are used to proxy for each asset class. Cash refers to the US Cash SRE. The forecast for each specific asset class is made using a proprietary methodology that is appropriate for that asset class. Equity asset classes use a proprietary forecasting methodology based on the assumption that equity valuations revert to their long-term trend over time. The methodology is built around specific valuation measures that require several stages of calculation. Assumptions on the projected growth of earnings and dividends are additionally applied to calculate the SRE of the equity asset class. Hedge Fund and Private Equity SREs are linked to equity SREs. Fixed Income asset class forecasts use a proprietary forecasting methodology that is based on current yield levels. Other asset classes use other specific forecasting methodologies. SREs are in US dollars. SREs are generally updated on an annual basis, however they may be updated off cycle based on market conditions or methodology adjustments. Strategic Return Estimates are no guarantee of future performance. SREs do not reflect the deduction of client fees and expenses. Future rates of return cannot be predicted with certainty. Investments that pay higher rates of return are often subject to higher risk and greater potential loss in an extreme scenario. The actual rate of return on investments can vary widely. This includes the potential loss of principal on your investment. It is not possible to invest directly in an index. All SRE information shown above is hypothetical not the actual performance of any client account. Hypothetical information reflects the application of a model methodology and selection of securities in hindsight. No hypothetical record can completely account for the impact of financial risk in actual trading.
A journey unfinished
We continue to believe that the worst of the reckoning is behind us. But, we aren’t at the end of the bear market journey quite yet. In our Roadmap to Recovery we argued there is a likely sequence of events that will need to unfold before we arrive at a true, sustained expansion (Figure 4). In short, it is simply too early to price in a new economic recovery while the Federal Reserve is still tightening monetary policy.
Figure 4. How the Recovery May Unfold Across 2023
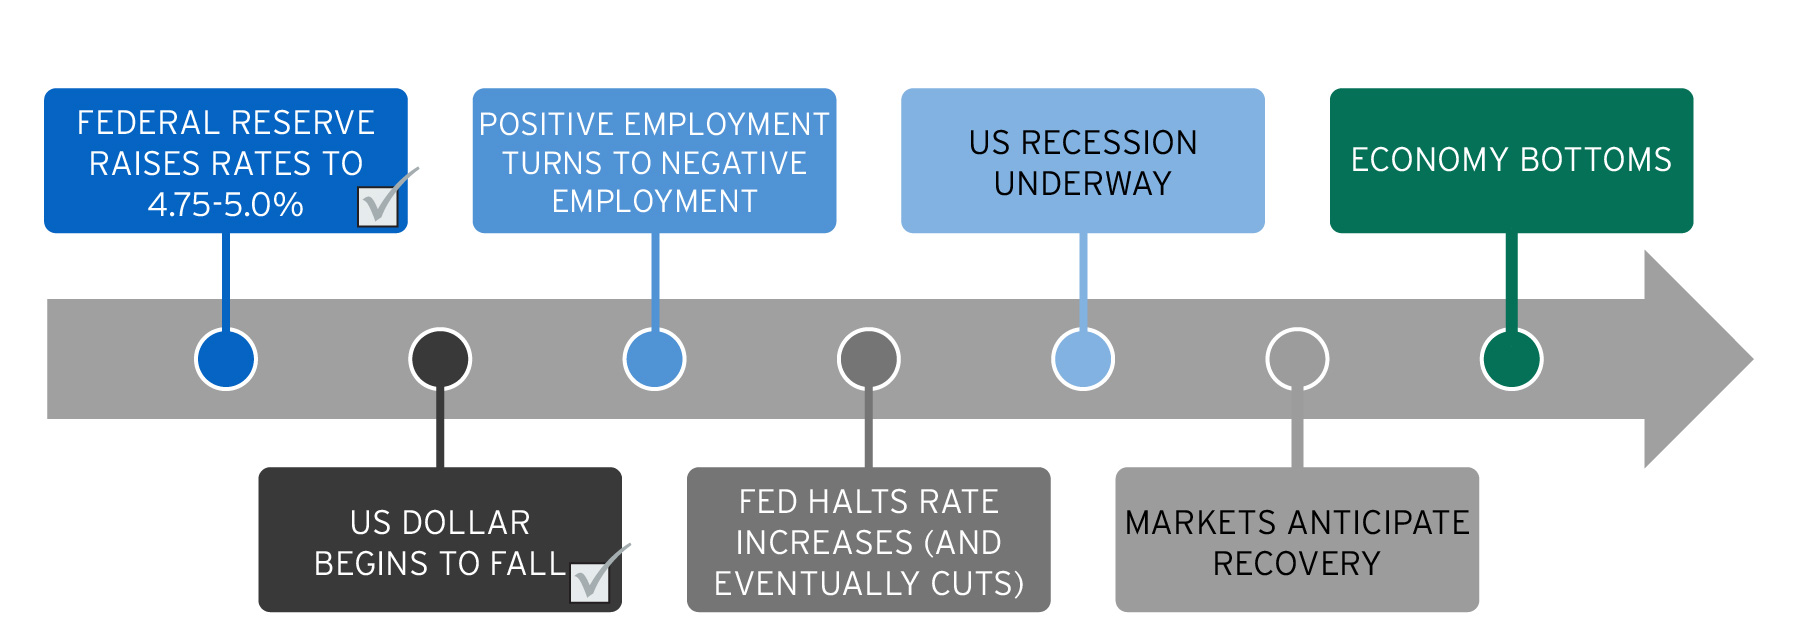
Source: Citi Global Wealth Investments’ Office of the Chief Investment Strategist as of March 31, 2023. All forecasts and expressions of opinion are subject to change without notice, and are not intended to be a guarantee of future events. Indices are unmanaged. An investor cannot invest directly in an index. They are shown for illustrative purposes only and do not represent the performance of any specific investment. Index returns do not include any expenses, fees or sales charges, which would lower performance. Past performance is no guarantee of future results. Real results may vary.
So far this year, investment performance across styles and sectors has been inconsistent. Our asset allocation has maintained a “quality income vigil.” We have retained an overweight stance on the most consistent dividend growers or companies with the strongest balance sheets since January 2022. In the AVS Risk Level 3 Portfolio, we have remained underweight small cap equities, companies that generally are more indebted and less able to endure macroeconomic cycles and shocks. Our overweight position on bonds remains concentrated in US government issues. While our near-term returns may lag behind episodic rallies, our positions should hold up against any selloffs. At the same time, the benefits of “playing defense” have been diminishing. Valuations are improving in some of the less defensive assets where we are currently underweight (Figure 5).
Figure 5. The Bear Market Has Claimed Victims in Smaller Companies
Source: Bloomberg as of May 26, 2023. Indices are unmanaged. An investor cannot invest directly in an index. They are shown for illustrative purposes only and do not represent the performance of any specific investment. Index returns do not include any expenses, fees or sales charges, which would lower performance. Past performance is no guarantee of future results. Real results may vary.
The benefits of diversification are evident again
After sharp yield increases, government bonds are again providing both regular income and a negative correlation to risk assets (See Bonds are Back Again: Where to find potential fixed income opportunities now). These are the properties that allow balanced stock and bond portfolios to have higher risk adjusted returns than individual asset classes (Figure 6). Thus far, performance of balanced portfolios suggests a period of stronger longer-term returns ahead.
Our updated economic forecast
We have always believed that one global shock should not require two recessions. The supply disruptions that came with COVID were not historically unique. All global supply shocks — whether through wars or embargoes — have destabilized consumer prices for a time (Figure 7). Policymakers arguably succeeded in limiting long-lasting economic damage from the initial pandemic shock. But their decision to provide broad and sustained stimulus even during the post-COVID recovery exacerbated a mismatch in supply and demand.
As the Fed eased monetary policy all through the US growth boom of 2021, inflation surged along with real GDP, which rose 6%. Subsequently, the Fed chose to tighten monetary policy through the present economic slowdown.
Figure 6. Correlation between Stock and Bond Returns
Source: Factset as of May 4, 2023. Indices are unmanaged. An investor cannot invest directly in an index. They are shown for illustrative purposes only and do not represent the performance of any specific investment. Index returns do not include any expenses, fees or sales charges, which would lower performance. Past performance is no guarantee of future results. Real results may vary.
Figure 7. Money Supply Leads Inflation by 2 Full Years
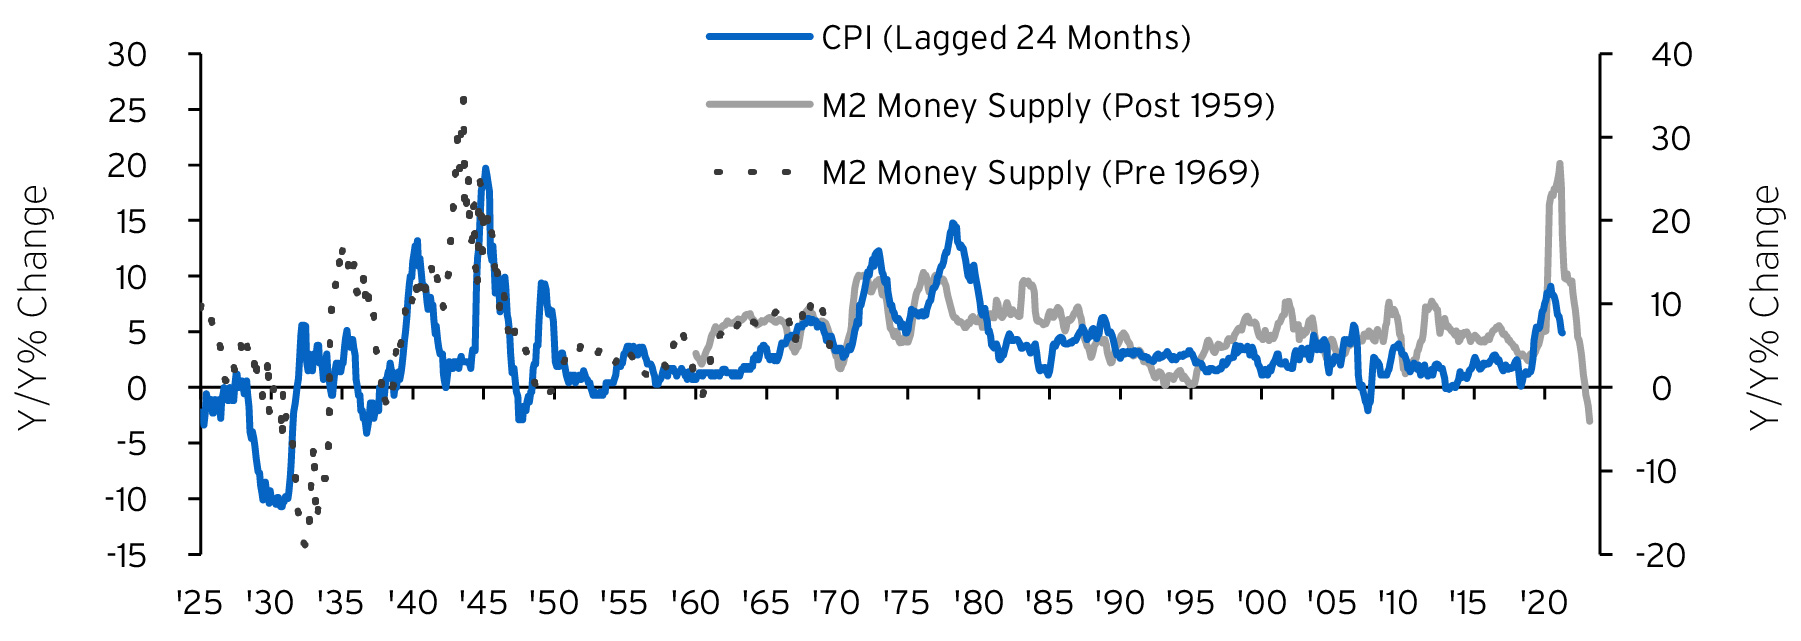
Source: Haver Analytics as of May 11, 2023.
We believe the full economic effects of the Fed’s tightening and the retrenchment of bank lending have not fully played out in the economy. When the Fed met in May, it raised policy rates to 5.125% and continued quantitative tightening (QT). This was despite the US Index of Leading Economic Indicators already being down 8% (Figure 8).
While the economy and Fed policy appear to be on a collision course, pent-up demand and momentum from the post-COVID rebound have meant a stronger US economy than we first anticipated in 2023. Adding to the momentum has been China’s earlier-than-expected reopening plus fading war-induced energy shocks. Taking into account all these developments, we’ve revised our 2023 growth forecasts slightly upward (Figure 9 and see our Regional Preview).
Figure 8. US Index of Leading Economic Indicators Year-Over-Year
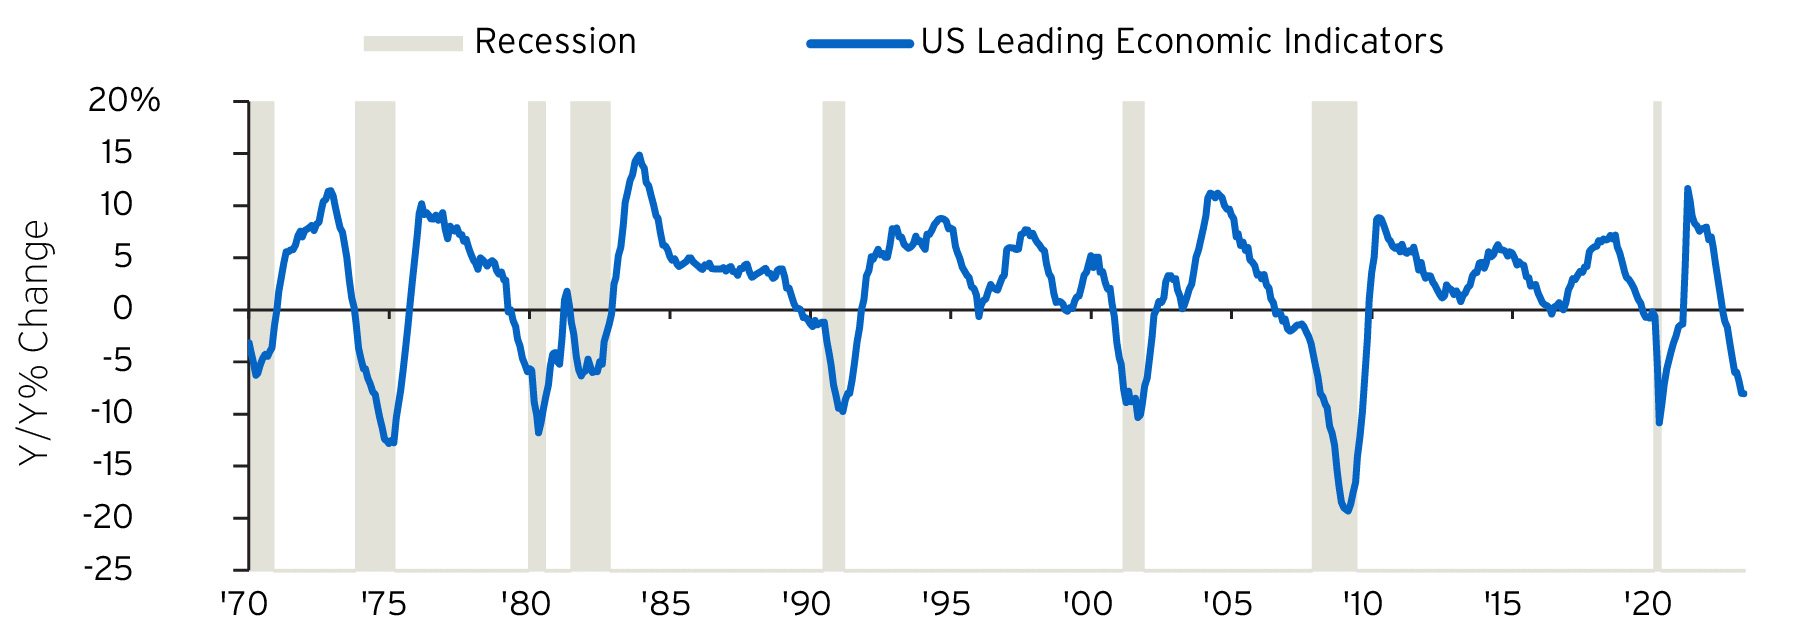
Source: Haver Analytics as of May 11, 2023. Gray areas are US recessions. Indices are unmanaged. An investor cannot invest directly in an index. They are shown for illustrative purposes only and do not represent the performance of any specific investment. Index returns do not include any expenses, fees or sales charges, which would lower performance. Past performance is no guarantee of future results. Real results may vary.
| As of May 2023 (Previous estimates are in parenthesis) | |||||
|---|---|---|---|---|---|
| 2020 | 2021 | 2022 | 2023 | 2024 | |
| China | 2.4 | 7.5 | 3.0 | 5.8 (5.5) ↑ | 4.5 (4.2) ↑ |
| US | -3.4 | 5.7 | 2.0 | 1.0 (0.5) ↑ | 1.4 (2.1) ↓ |
| EU | -6.3 | 5.4 | 3.6 | 0.8 (0.0) ↑ | 1.1 ↑ |
| UK | -11.0 | 7.6 | 4.1 | 0.3 (-0.5) ↑ | 1.1 ↑ |
| Global | -3.2 | 5.7 | 3.4 | 2.5 (2.0) ↑ | 2.4 (2.4) |
Source: Haver Analytics and Citi Global Wealth Investments as of May 2023. All forecasts and expressions of opinion are subject to change without notice, and are not intended to be a guarantee of future events. Indices are unmanaged. An investor cannot invest directly in an index. They are shown for illustrative purposes only and do not represent the performance of any specific investment. Index returns do not include any expenses, fees or sales charges, which would lower performance. Past performance is no guarantee of future results. Real results may vary.
Dragging on our 2023 and 2024 outlook, however, are the impacts of greater-than-expected policy tightening as the Fed confronts “labor hoarding” by employers in the US. This suggest that the negative impact from tightening has simply been pushed to a later date (Figure 10). Our US real GDP forecast for 2023 has been raised to 1% from 0.5%, but we have cut our 2024 forecast to 1.4% from 2.1%.
The slowest period for the US economy is likely to come in either 2023 or the beginning of 2024. Together, these two years are likely to show below trend growth until the US economy rebuilds “slack” and US monetary policy eases. For now, the US continues to reflect its major difference in government policies pre- and post-COVID versus China’s policy-induced hard landing and rapidly rising unemployment (Figure 11).
Figure 10. Falling Productivity as Employers Hoard Labor
Source: Haver Analytics as of May 22, 2023.
Figure 11. Contrasting Cycles – Unemployment Rates in the US and China
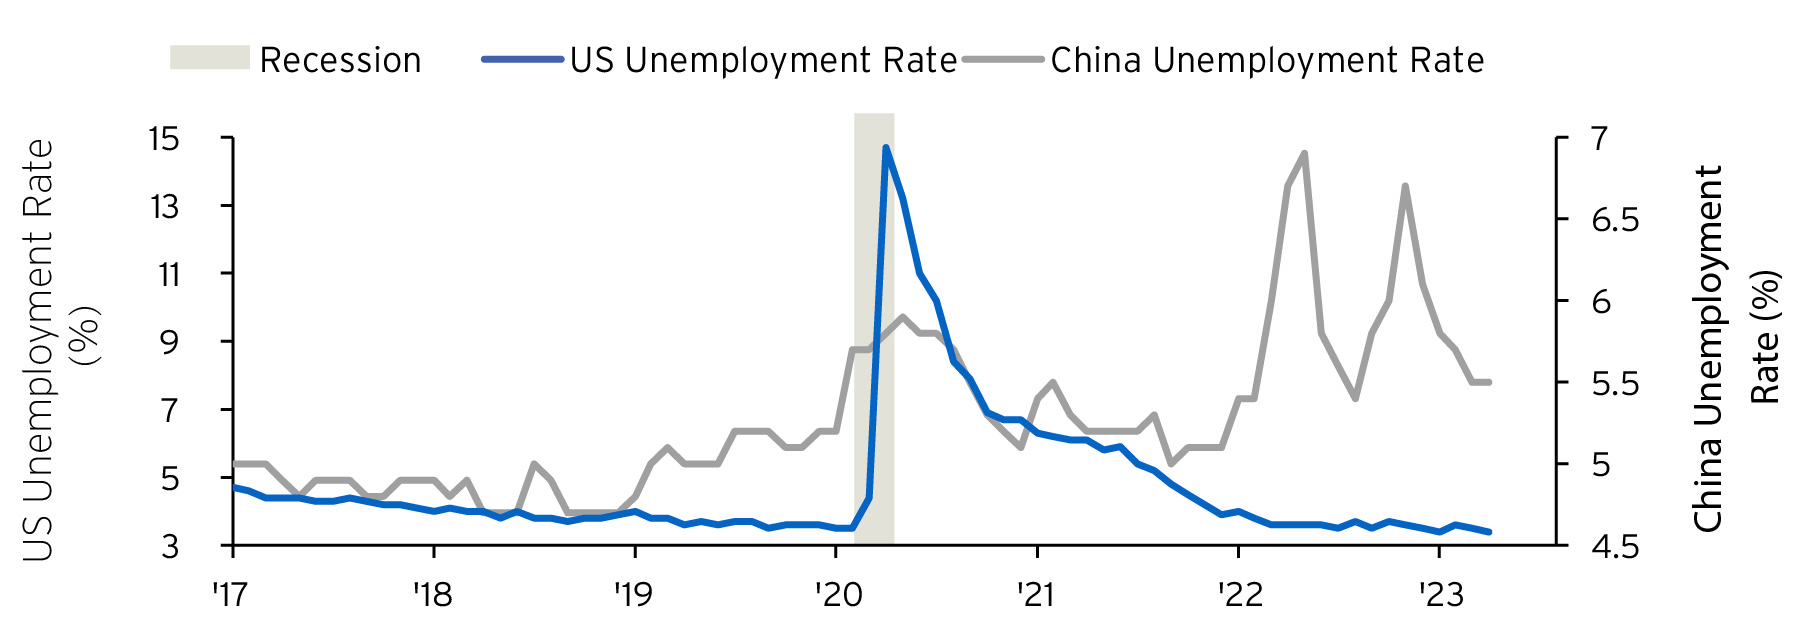
Source: Haver Analytics as of May 22, 2023.
Less inflation on the horizon
We believe headline US Consumer Price Index (CPI) inflation is set to slow to 3.5% by the end of 2023, down from 6.5% at the end of 2022. A further decline is likely to get close to the Fed’s 2% target in 2024. Getting there will require some economic pain.
Consider how zero policy rates helped finance a record number of multi-family housing construction activity since COVID struck (Figure 12). These “long cycle” apartment projects will be delivered later this year and all through the next. Sharply higher financing costs suggest there will be a collapse in new construction and related unemployment will follow. On the other hand, the increased supply of rental units should significantly cool shelter price inflation, a key CPI component that is still reaching new cycle highs at mid-year 2023.
Figure 12. US Multi-Family Apartments Under Construction vs Related Construction Employment Y/Y%
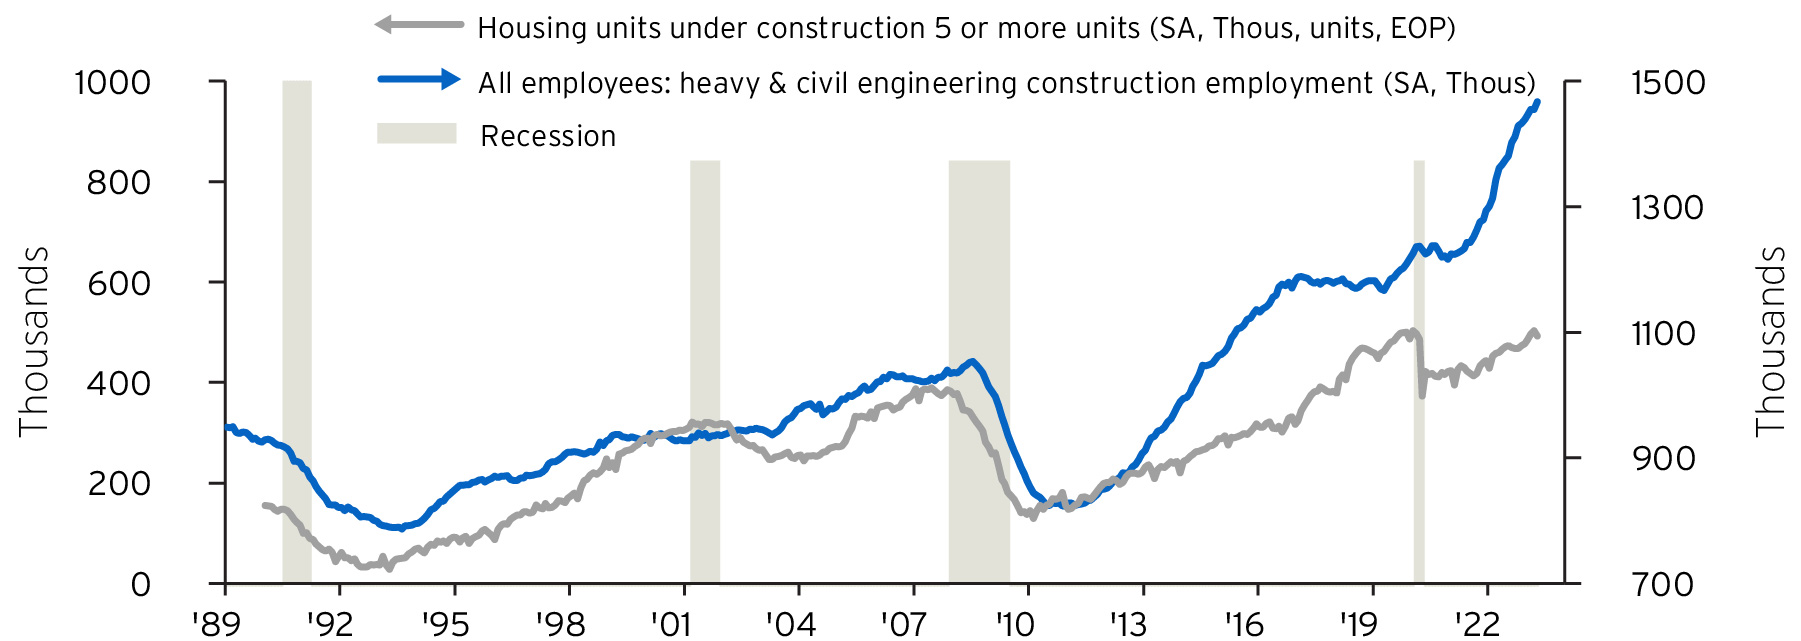
Source: Haver Analytics as of May 22, 2023. Gray areas are US recessions.
More volatility to come
As we write, the US Congress has just passed a suspension of the statutory debt ceiling through January 2025. This will open the floodgates to a stepped up round of borrowing as the US Treasury replenishes its nearly depleted cash balance. Aside from borrowing to finance US deficits, net new Treasury bill issuance in the months ahead could exceed $300 billion and $1.3 trillion across all US Treasury issues by the end of 2023. At presently high yields, the borrowing could displace other asset classes and temporarily boost the US dollar. If so, we would see it as a stronger opportunity to add to non-US assets for the years to come. For example, we have already added overweights in Brazil and emerging markets in Asia (See Currencies).
The situation for the US is also quite different from 2011 when the S&P 500 fell more than 15% after a debt ceiling agreement was reached. In the period that followed, US shares recovered sharply and outperformed the world during the next decade. However, at the time of that fiscal deal, the US unemployment rate exceeded 8.5% and the Fed’s policy rate hugged zero. US corporate profits were still deeply depressed from the Global Financial Crisis of 2007-2008. Therefore, profits rose rapidly in the years that followed. Today, the Fed is still restraining the US economy and US corporate profits are high but on the decline. For these reasons, we don’t believe large cap US equities will lead global equity returns in the coming few years.
Our future set of potential opportunities
Last year, soaring bond yields collapsed growth stocks. This year, growth-style investing recovered. The gains, however, have been concentrated in the largest firms with the strongest balance sheets. The S&P 500 IT sector has returned 35% year to date while the S&P 600 IT sector has returned more than 15%.
We maintain overweight positions in long-term growth drivers such as cybersecurity and look opportunistically at artificial intelligence and renewable energy. We’re also focused on future increases in our allocation to global small- and mid-caps over large-caps as large-caps are already trading at 25 times trailing earnings per share (EPS). By contrast, profitable US small- and medium-cap (SMID) shares are trading near a 30% discount to large-cap shares on 2023 estimates.
Similar or even larger valuation discounts can be found in international equity markets. The valuation gap is further compounded by the strong US dollar. This should help non-US markets generate enhanced returns in the decade to come. We’ve already shifted portfolios to address the opportunity.
In the year to date, our position in large-cap US equities has outperformed an underweight in small caps by more than 900 basis points. We are not yet ready to relinquish this component of our defensive posture (Figure 13). However, as “defensive” shares have become consensus overweights - in some cases having seen substantial upward revaluation - returns are becoming more compelling for the shares left behind, even if an investor is “early.”
Historical data shows that only twice in the past century has a bear market in US shares taken longer than two calendar years to bottom. While we are not yet in a convincing bull market cycle, we expect to be further along in our investment journey by the time of our Wealth Outlook 2024.
Figure 13. Small- and Mid-Cap Outperformance Tends to be Highly Concentrated in Early Bull Markets
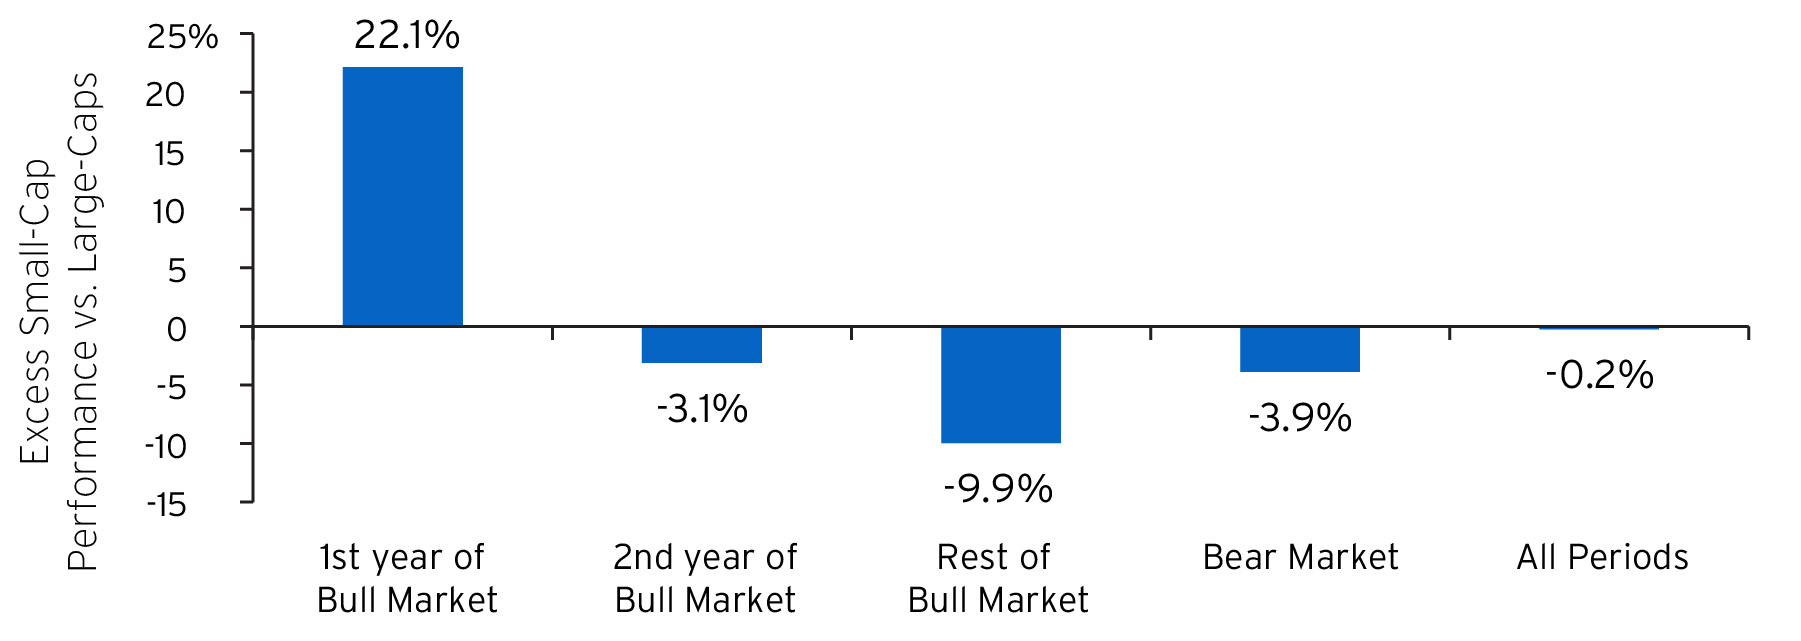
Source: Haver Analytics as of May 12, 2023. Small caps proxied with Russell 2000 and large caps proxied with S&P 500. All forecasts are expressions of opinion and are subject to change without notice and are not intended to be a guarantee of future events. Indices are unmanaged. An investor cannot invest directly in an index. They are shown for illustrative purposes only and do not represent the performance of any specific investment. Index returns do not include any expenses, fees or sales charges, which would lower performance. Past performance is no guarantee of future results. Real results may vary.
Contact us
To help put you in touch with the right Private Bank team, please answer the following questions.